
London Airport (Heathrow) Reported Road Casualties
This web page shows data only up to 2018.
For tables and charts that include 2019 data for each police area and each local authority, go to pedestriansafety.org.uk/stats.php
For tables and charts that include 2019 data for each police area and each local authority, go to pedestriansafety.org.uk/stats.php
This is a report on the Department for Transport (DfT STATS19) records of road casualties in the London Airport (Heathrow) Highway Authority area. See Notes for information on highway authorities. The sections are
1. Number of children killed or seriously injured
2. Numbers (all ages) killed or seriously injured
3. Numbers (all ages) killed
4. Notes and sources
1. Number of children killed or seriously injured
2. Numbers (all ages) killed or seriously injured
3. Numbers (all ages) killed
4. Notes and sources
1. Number of children killed or seriously injured
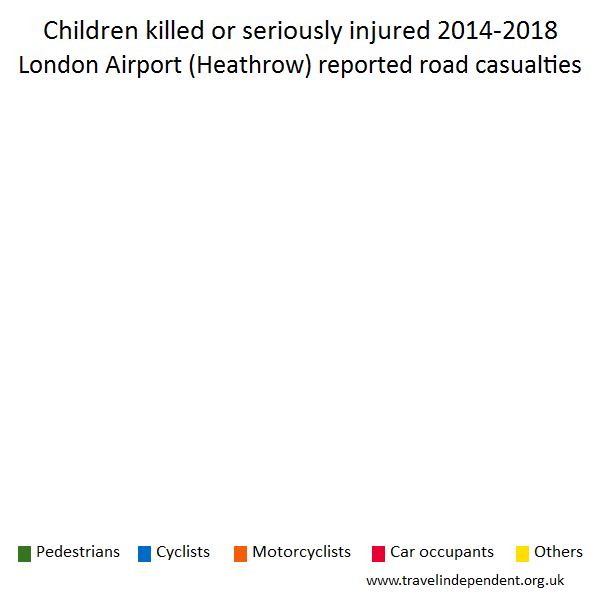
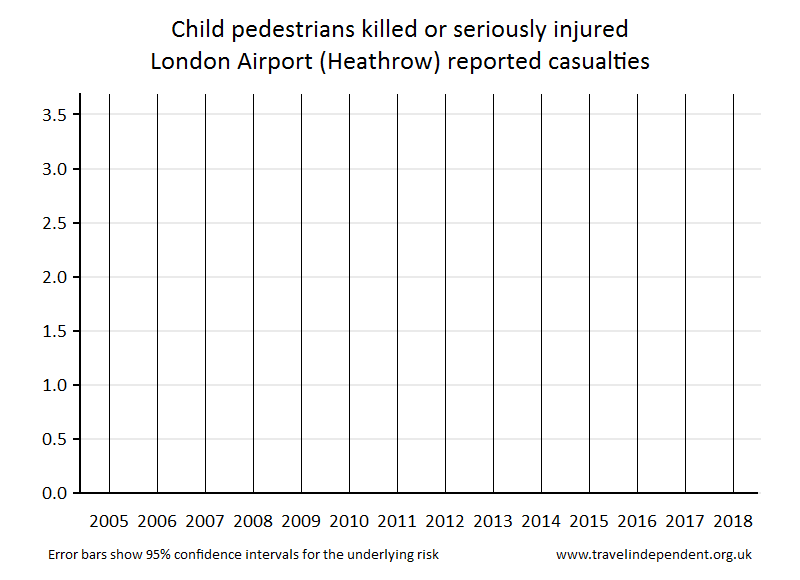
The pie chart shows the breakdown by method of travel for children reported as killed or seriously injured (KSI) during 2014 - 2018. The bar chart shows KSI numbers for child pedestrians yearly since 2005. The 'error bars' show the 95% confidence intervals - read more on confidence intervals hereread more on confidence intervals at www.travelindependent.org.uk/confidence_intervals.html including why they are needed when interpreting charts.'Children' refers to the age range of 0 - 15 years.
 |  |
| London Airport (Heathrow) Children Reported Killed or Seriously Injured | ||||||
|---|---|---|---|---|---|---|
| Pedestrians | Cyclists | Motorcyclists | Car occupants | Others | Total | |
| 2005 | 0 | 0 | 0 | 0 | 0 | 0 |
| 2006 | 0 | 0 | 0 | 0 | 0 | 0 |
| 2007 | 0 | 0 | 0 | 0 | 0 | 0 |
| 2008 | 0 | 0 | 0 | 0 | 0 | 0 |
| 2009 | 0 | 0 | 0 | 0 | 0 | 0 |
| 2010 | 0 | 0 | 0 | 0 | 0 | 0 |
| 2011 | 0 | 0 | 0 | 0 | 0 | 0 |
| 2012 | 0 | 0 | 0 | 0 | 0 | 0 |
| 2013 | 0 | 0 | 0 | 0 | 0 | 0 |
| 2014 | 0 | 0 | 0 | 0 | 0 | 0 |
| 2015 | 0 | 0 | 0 | 0 | 0 | 0 |
| 2016 | 0 | 0 | 0 | 0 | 0 | 0 |
| 2017 | 0 | 0 | 0 | 0 | 0 | 0 |
| 2018 | 0 | 0 | 0 | 0 | 0 | 0 |
| Last 5 years | 0 | 0 | 0 | 0 | 0 | 0 |
2. Numbers (all ages) killed or seriously injured
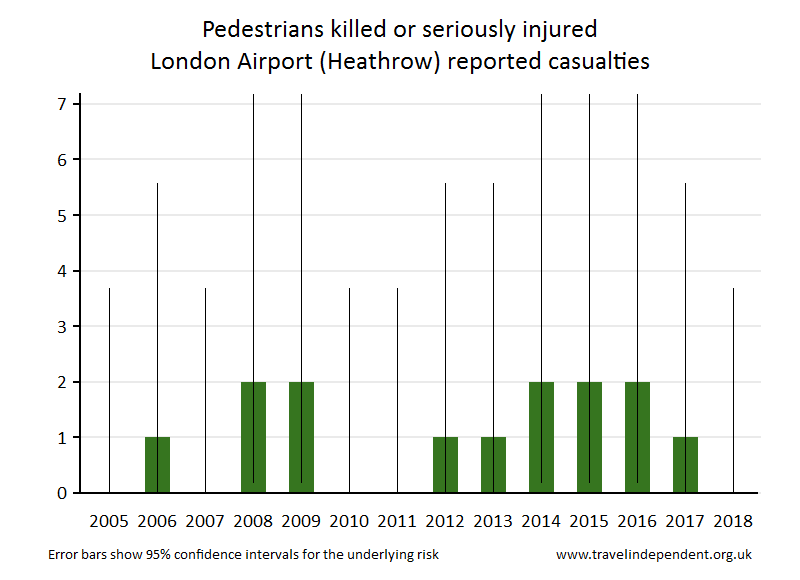
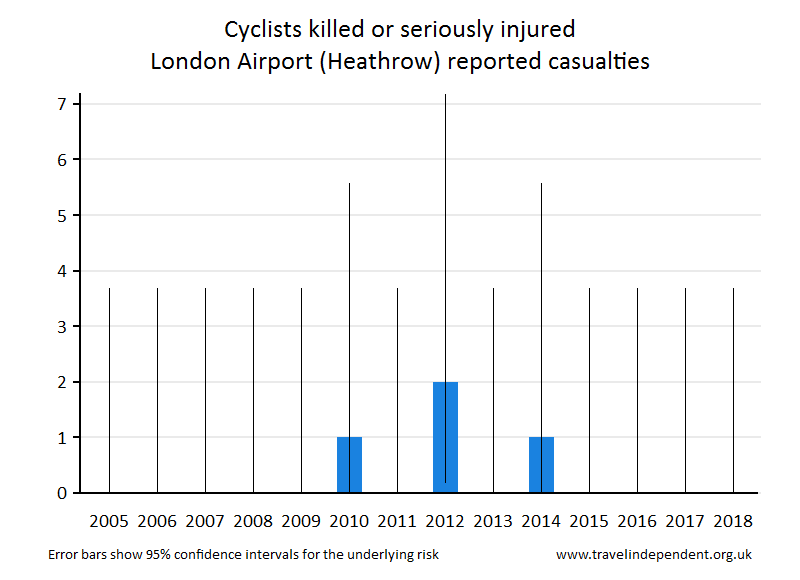
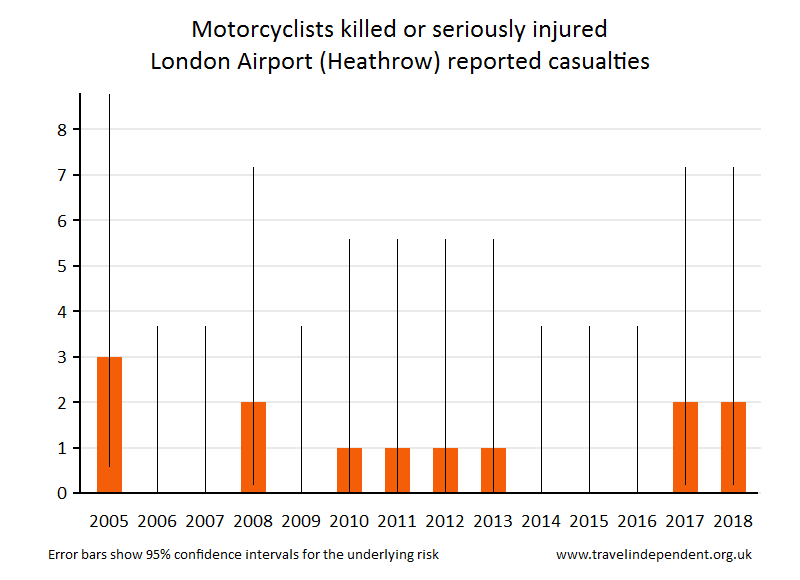
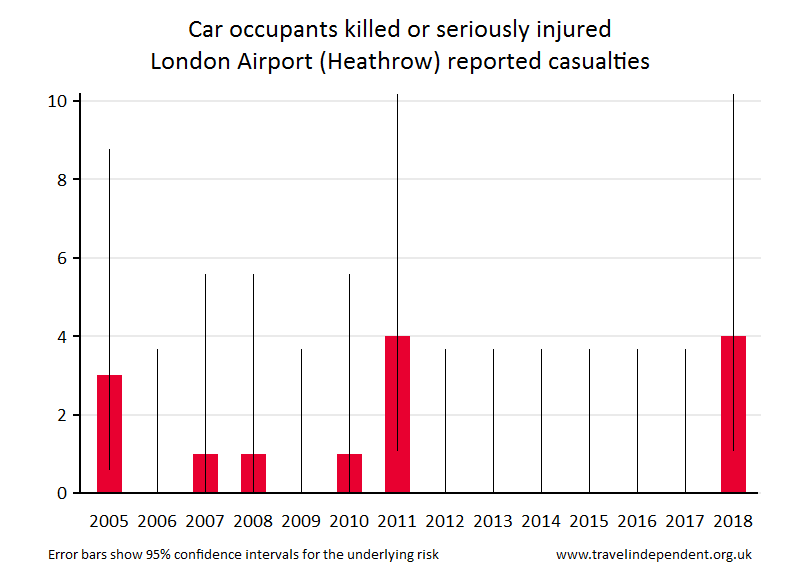
The charts give the numbers of reported casualties for each method of travel by year (except for the bottom right chart, which gives the percentages of the total).| Pedestrians | Cyclists |
 |  |
| Motorcyclists | Car occupants |
 |  |
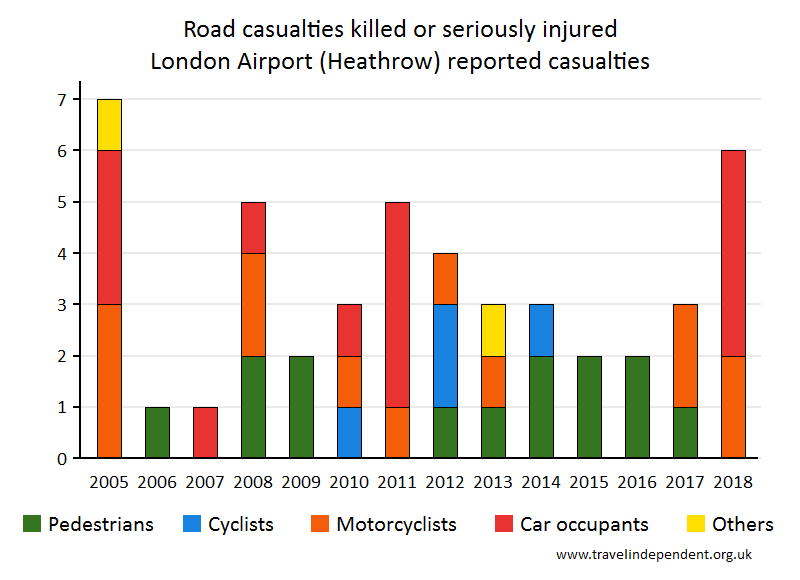
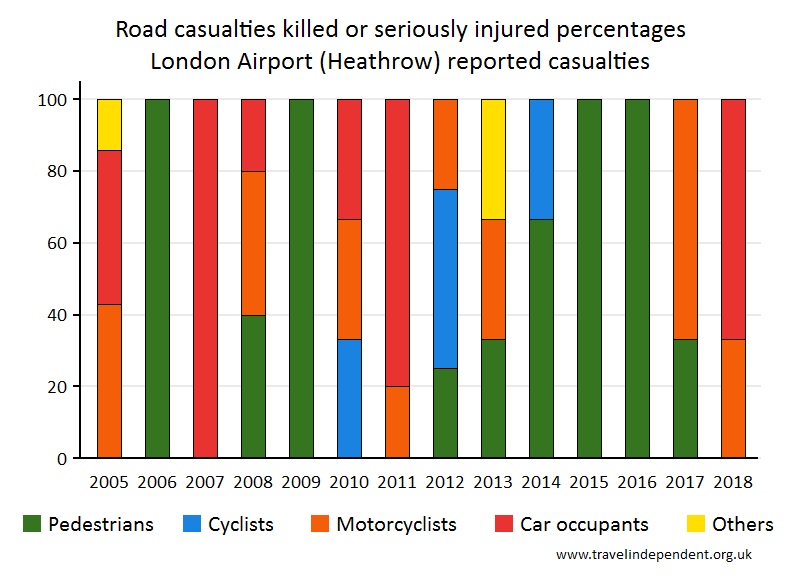
| All modes (numbers) | All modes (percentages) |
 |  |
| London Airport (Heathrow) Reported Road Casualties Killed or Seriously Injured | ||||||
|---|---|---|---|---|---|---|
| Pedestrians | Cyclists | Motorcyclists | Car occupants | Others | Total | |
| 2005 | 0 | 0 | 3 (43%) | 3 (43%) | 1 (14%) | 7 (100%) |
| 2006 | 1 (100%) | 0 | 0 | 0 | 0 | 1 (100%) |
| 2007 | 0 | 0 | 0 | 1 (100%) | 0 | 1 (100%) |
| 2008 | 2 (40%) | 0 | 2 (40%) | 1 (20%) | 0 | 5 (100%) |
| 2009 | 2 (100%) | 0 | 0 | 0 | 0 | 2 (100%) |
| 2010 | 0 | 1 (33%) | 1 (33%) | 1 (33%) | 0 | 3 (100%) |
| 2011 | 0 | 0 | 1 (20%) | 4 (80%) | 0 | 5 (100%) |
| 2012 | 1 (25%) | 2 (50%) | 1 (25%) | 0 | 0 | 4 (100%) |
| 2013 | 1 (33%) | 0 | 1 (33%) | 0 | 1 (33%) | 3 (100%) |
| 2014 | 2 (67%) | 1 (33%) | 0 | 0 | 0 | 3 (100%) |
| 2015 | 2 (100%) | 0 | 0 | 0 | 0 | 2 (100%) |
| 2016 | 2 (100%) | 0 | 0 | 0 | 0 | 2 (100%) |
| 2017 | 1 (33%) | 0 | 2 (67%) | 0 | 0 | 3 (100%) |
| 2018 | 0 | 0 | 2 (33%) | 4 (67%) | 0 | 6 (100%) |
3. Numbers (all ages) killed
| London Airport (Heathrow) Reported Road Casualties Killed | ||||||
|---|---|---|---|---|---|---|
| Pedestrians | Cyclists | Motorcyclists | Car occupants | Others | Total | |
| 2005 | 0 | 0 | 0 | 0 | 0 | 0 |
| 2006 | 0 | 0 | 0 | 0 | 0 | 0 |
| 2007 | 0 | 0 | 0 | 0 | 0 | 0 |
| 2008 | 1 (100%) | 0 | 0 | 0 | 0 | 1 (100%) |
| 2009 | 1 (100%) | 0 | 0 | 0 | 0 | 1 (100%) |
| 2010 | 0 | 0 | 0 | 0 | 0 | 0 |
| 2011 | 0 | 0 | 0 | 0 | 0 | 0 |
| 2012 | 1 (100%) | 0 | 0 | 0 | 0 | 1 (100%) |
| 2013 | 0 | 0 | 0 | 0 | 1 (100%) | 1 (100%) |
| 2014 | 2 (100%) | 0 | 0 | 0 | 0 | 2 (100%) |
| 2015 | 0 | 0 | 0 | 0 | 0 | 0 |
| 2016 | 0 | 0 | 0 | 0 | 0 | 0 |
| 2017 | 0 | 0 | 0 | 0 | 0 | 0 |
| 2018 | 0 | 0 | 0 | 0 | 0 | 0 |
4. Notes and Sources
A highway authority is the council or other organisation that is responsible for the maintenance of public roads. The Highway Authority is usually the county council or the unitary authority for a particular area.The information summarised here is taken from what is collected by police forces on each road collision in which someone is injured (using the STATS19 reporting form). This is collected and published annually by the DfT. Charts and tables have been generated from databases downloaded from the DfT website.
Almost all road deaths are reported, but some serious injuries are not reported and only a minority of slight injuries are reported - see the discussions in the annual DfT reports.
"Car occupant" includes car driver, car passenger, taxi/private hire car occupant, and minibus (8 - 16 passenger seats) occupant, in line with DfT practice.
KSI and fatality figures in this document are also available in various DfT publications - see heresee www.travelindependent.org.uk/links.html.
| www.travelindependent.org.uk |