
Police area comparison maps and rankings
Update 2015:
The rankings for pedestrian KSI casualties have been updated with the DfT data up to and including 2014, and the analyses have been published on the www.pedestriansafety.org.uk website.
The rankings for pedestrian KSI casualties have been updated with the DfT data up to and including 2014, and the analyses have been published on the www.pedestriansafety.org.uk website.
This report, published in November 2013, presents an analysis of the 2012 DfT database of reported killed or seriously injured (KSI) road casualties for each of the four main modes of travel, with a comparison of police force areas by means of maps and rankings.
Download report with maps and rankings from here
It is not clear who has the responsibility for monitoring figures, comparing policies, and drawing conclusions on best practice. We were unable to find any evidence of work being carried out by:
- Her Majesty's Inspectorate of Constabulary
- The Association of Chief Police Officers, or
- The Department for Transport.
Key Points
Pedestrian KSI casualties: The three worst rates per head of population were in
| 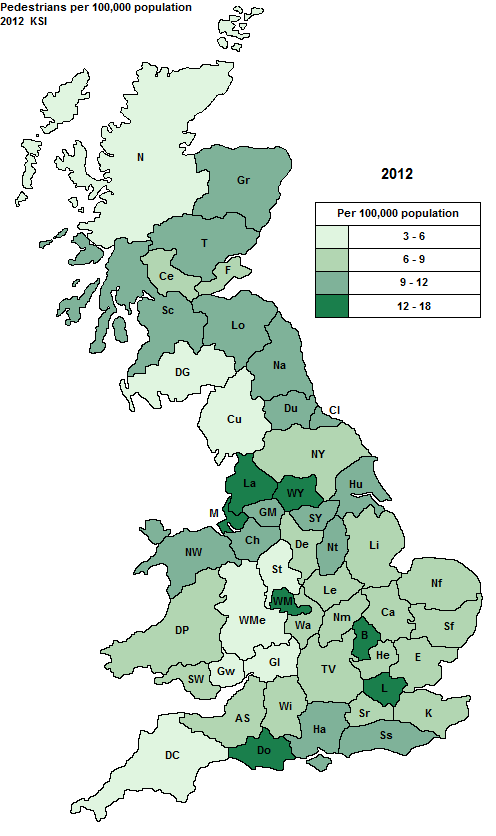 |
Child pedestrian KSI casualties: The three worst rates were in
| 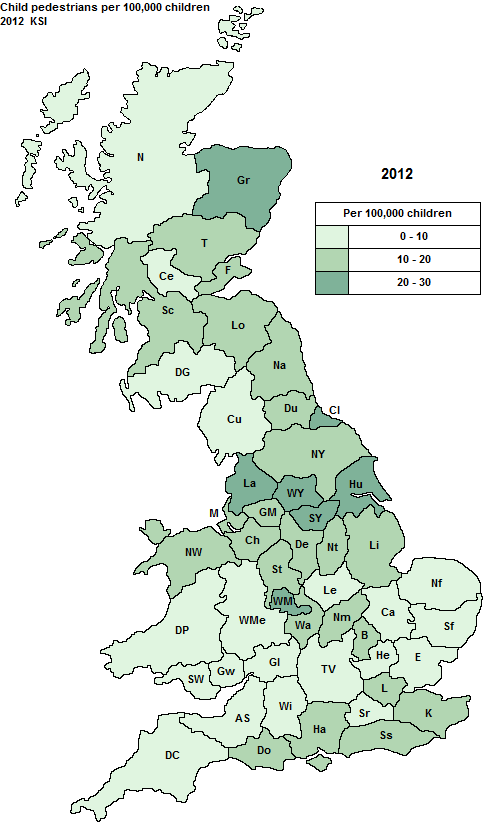 |
Cyclist KSI casualties: The three worst rates were in
| 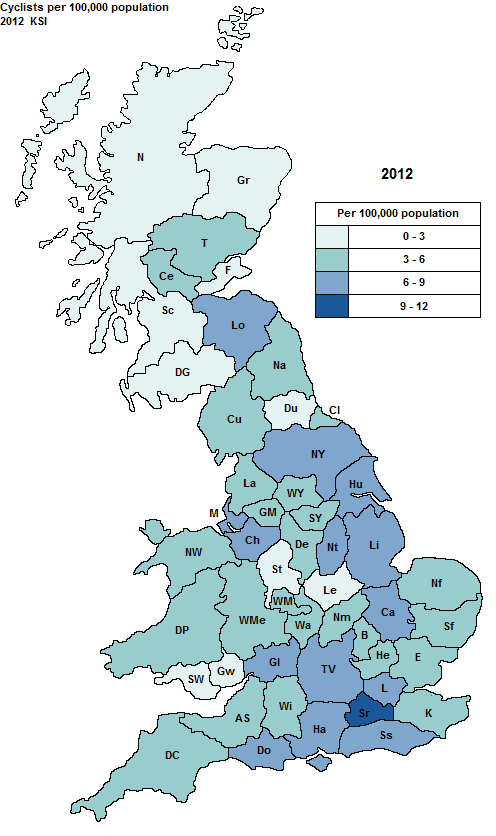 |
Child cyclist KSI casualties: The three worst rates were in
| 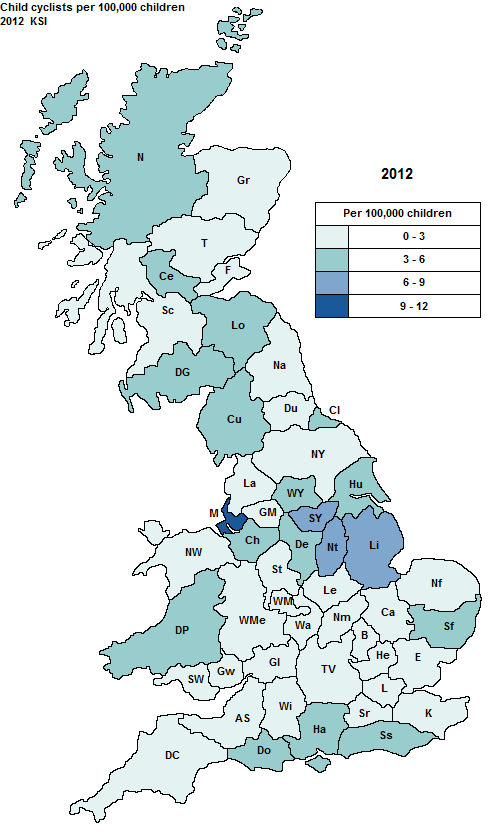 |
Motorcyclist KSI casualties: The three worst rates were in
| 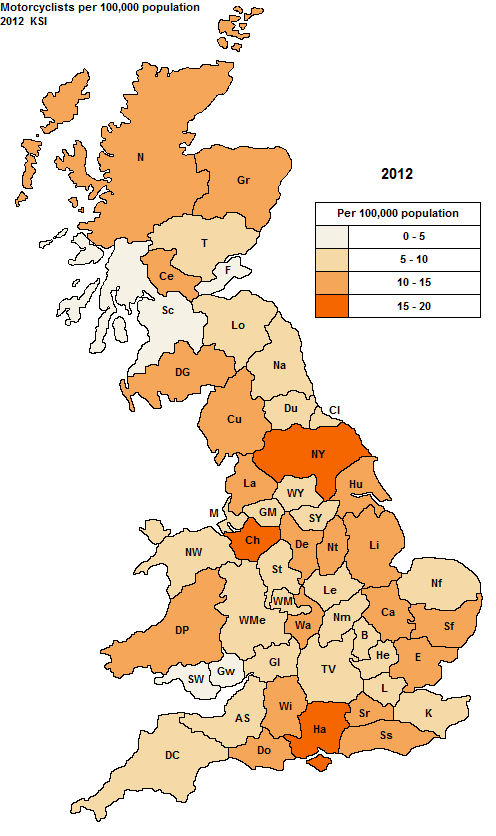 |
Car occupant KSI casualties: The three worst rates were in
| 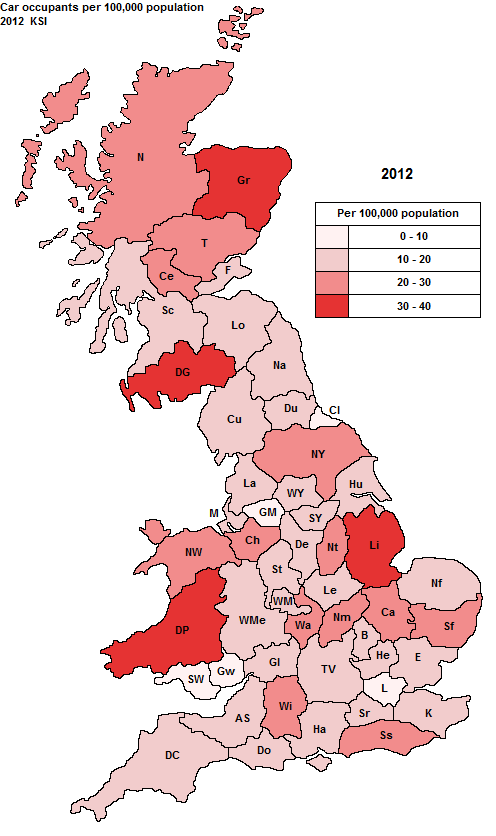 |
Download report with maps and rankings from here