
Road Casualty Reports, Analyses and Tools
2018 reported road casualties: charts and tables for each police force and each local authority
The latest Department for Transport reported road casualty summary figures (for 2018) and STATS19 databases were released in September 2019.
| Charts and tables are published here for each of the main groups of pedestrians, cyclists, motorcyclists and car occupants. See each local authority's charts and tables. See each police area's charts and tables. See national summary charts and tables. | 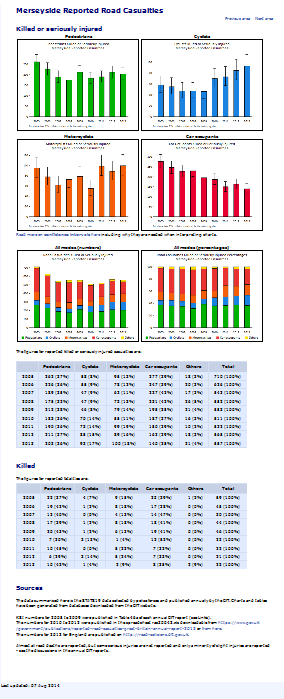 |
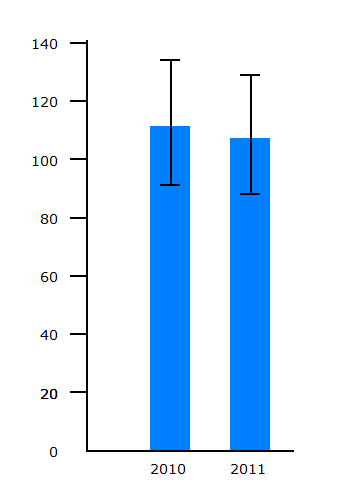
Draw charts for counts
| A new online tool allows users to enter data to draw and download charts for counts (such as road casualty figures) with confidence intervals. See here. |  |
2014 reported road casualties: charts and tables
The latest Department for Transport reported road casualty summary figures (for 2015) and STATS19 databases were released in June 2015.
| Charts and tables are published here for each of the main groups of pedestrians, cyclists, motorcyclists and car occupants. See each local authority's charts and tables. See each police area's charts and tables. See national summary charts and tables. | |
Children killed or seriously injured
| The chart shows the breakdown by mode of travel for children reported as killed or seriously injured (KSI) in Great Britain during 2013. Read more here. Out of the total of 1980 children, 1358 (69%) were child pedestrians and 282 (14%) were child cyclists - i.e. 83% were pedestrians or cyclists ('children' are defined as aged 0 - 15 years). A similar breakdown is available here for each highway authority, & for each police area in Great Britain. | 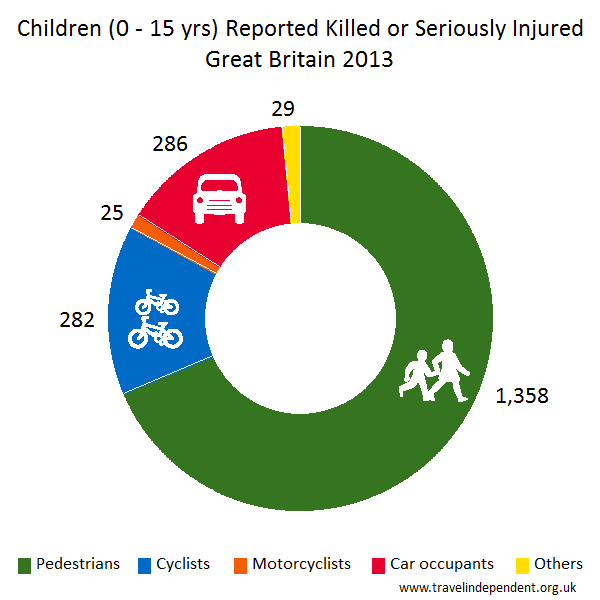 |
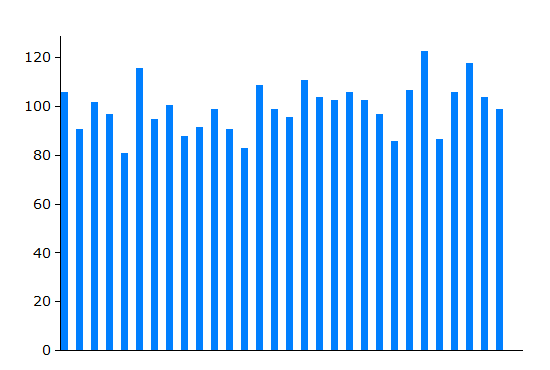
Fatality risks per km for different modes of travel
| The bar chart plots risks per km for different modes of travel. Read more here. | 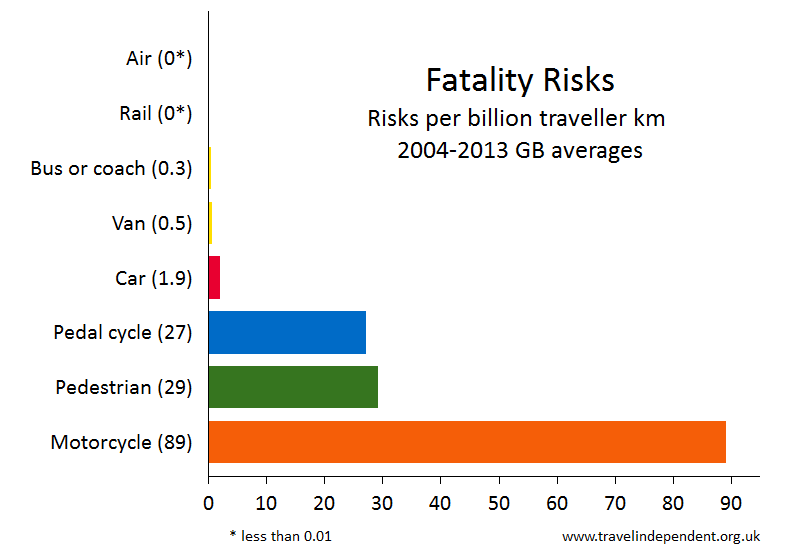 |
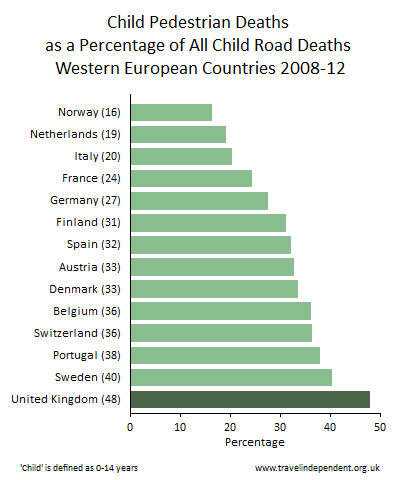
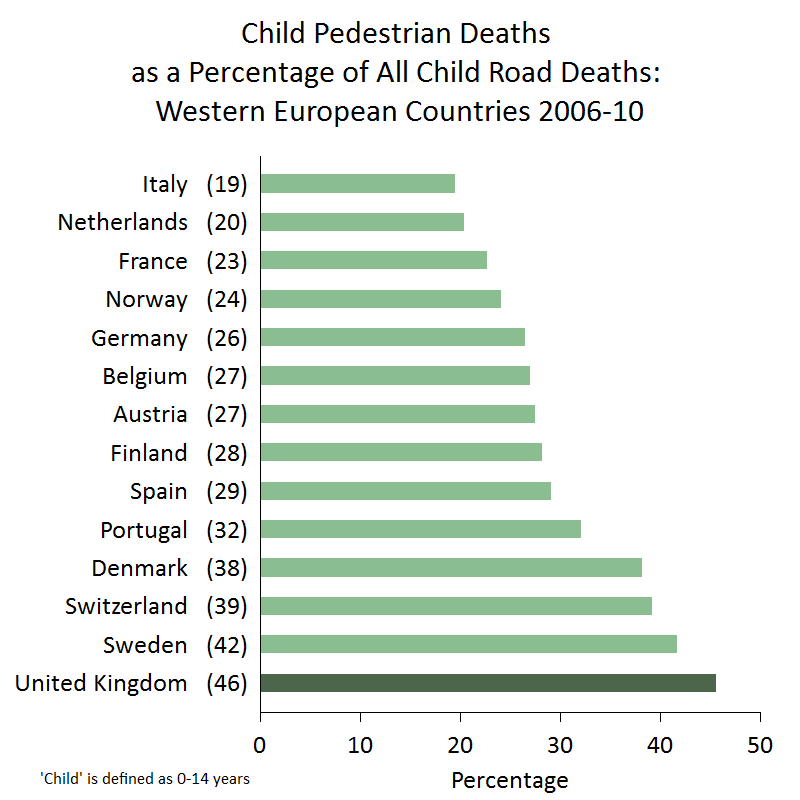
Pedestrian deaths in western European countries
(November 2014)An analysis of pedestrian deaths in western European countries was done for the 5-year period of 2008-12.
- There was a wide variation in pedestrian death rates, with the lowest being in the Netherlands, Sweden and Norway.
- The UK had a child pedestrian death rate double the rates of Norway and the Netherlands.
- In the UK, 48% of children killed on the roads were child pedestrians - this is the highest proportion in western European countries (left chart).
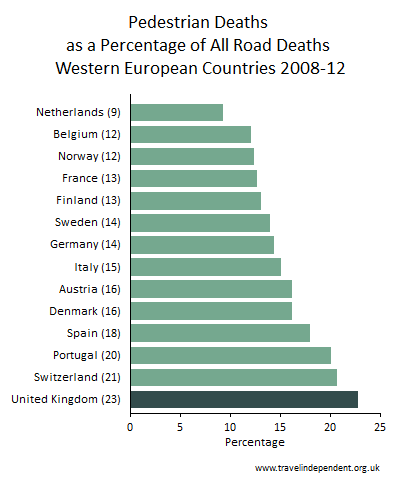
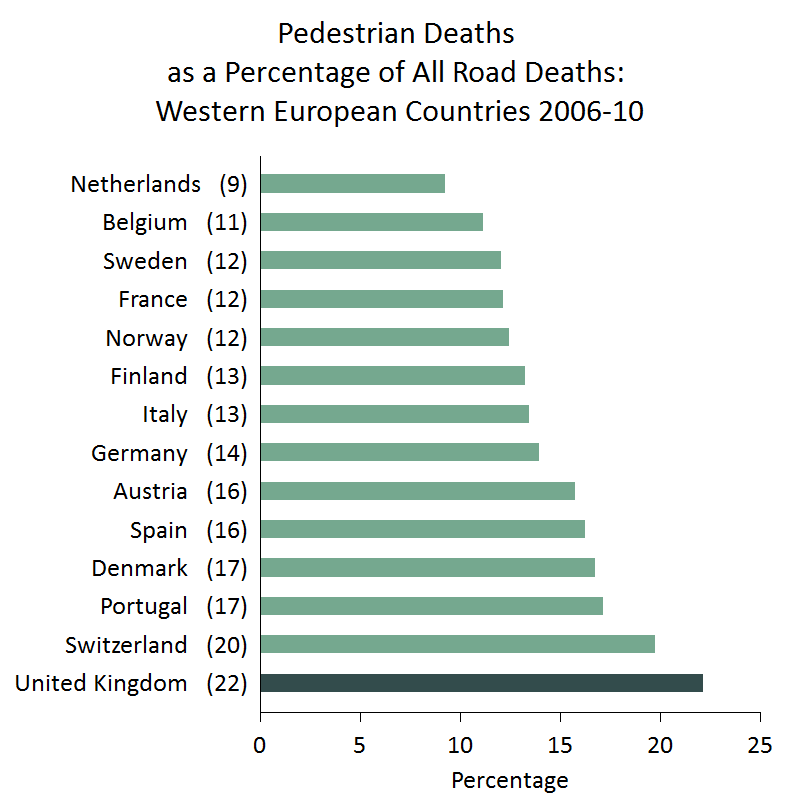
- Including all ages, 23% of UK road deaths were pedestrians - again the highest proportion in western European countries (right chart).
 |  |
Reported road casualties for 2013: charts and tables
(August 2014)The latest Department for Transport reported road casualty summary figures (for 2013) and STATS19 databases were released in June/July 2014.
| We have produced charts and tables for each of the main groups of pedestrians, cyclists, motorcyclists and car occupants. See national summary charts and tables. See each police area's charts and tables. See each local authority's charts and tables. | |
Mapping and ranking by police area of 2012 pedestrian, cyclist, motorcyclist and car occupant road casualty data
(November 2013)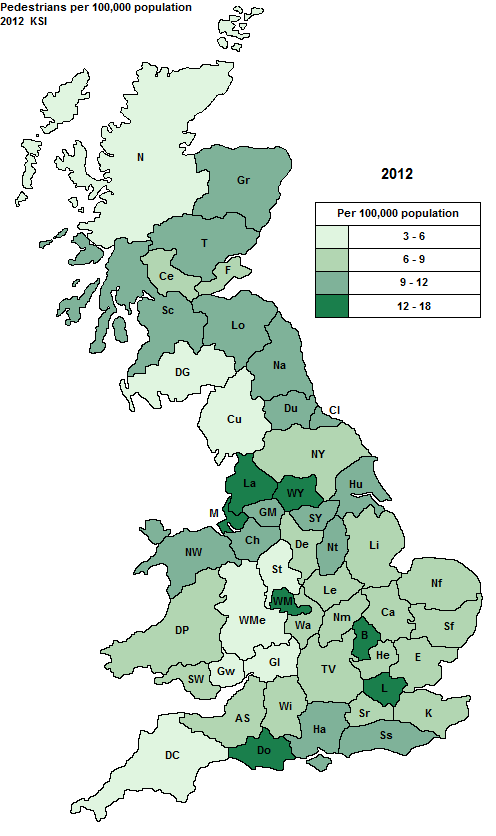 |  | 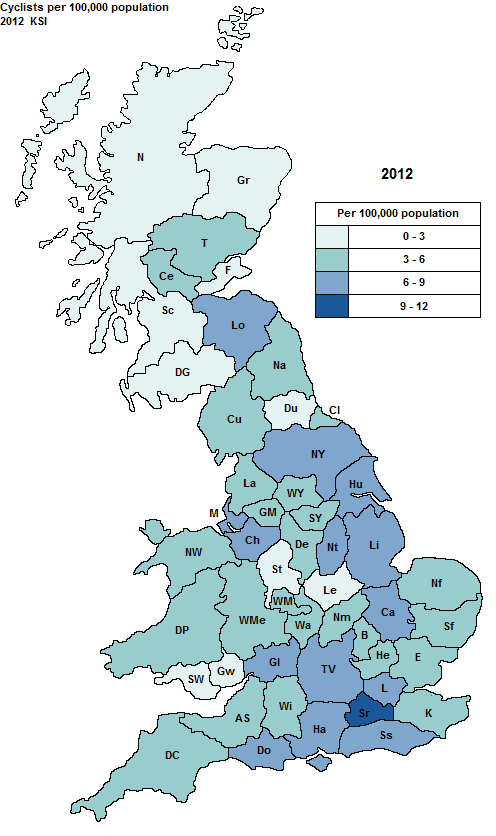 | 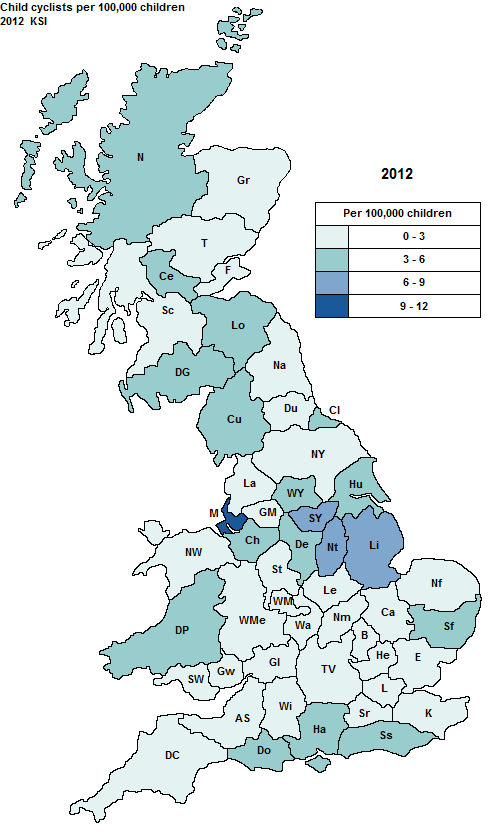 | 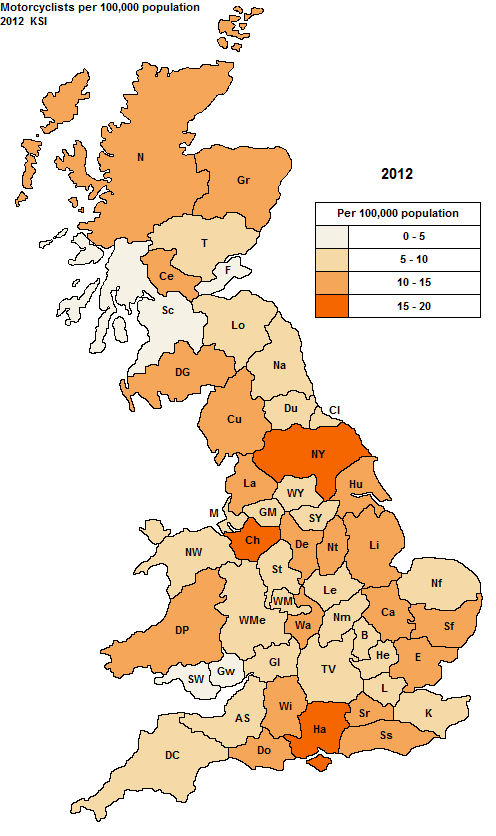 | 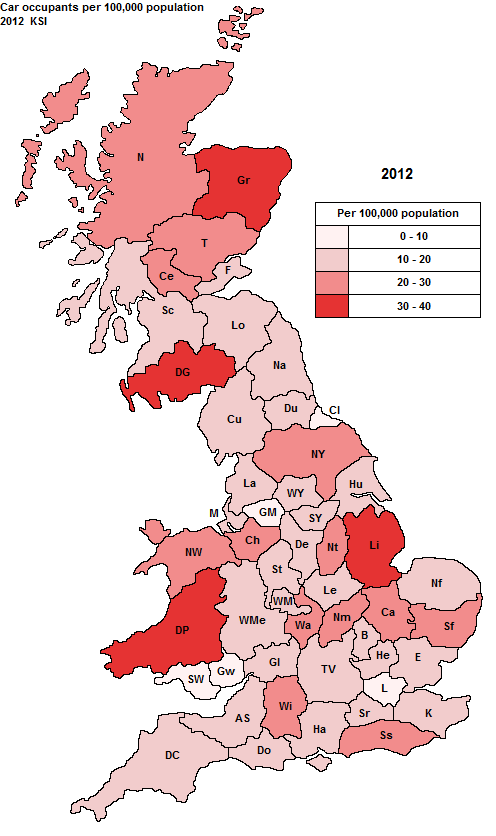 |
Download report from here
Reported road casualties for 2012: charts and tables
(September 2013)The latest Department for Transport reported road casualty summary figures (for 2012) were released in June 2013.
See national summary charts and tables
The annual DfT report (for 2012) was released in September 2013.
See local authority charts and tables.
See police area charts and tables.
Pedestrian deaths in western European countries
(May 2013)- In the UK, in the 5-year period of 2006-10, 46% of children killed on the roads were child pedestrians.
- Including all ages, in the same period, 22% of UK road deaths were pedestrians.
- These proportions are the highest for western European countries.
 |  |
Mapping of cyclist casualty data by police area
(May 2013)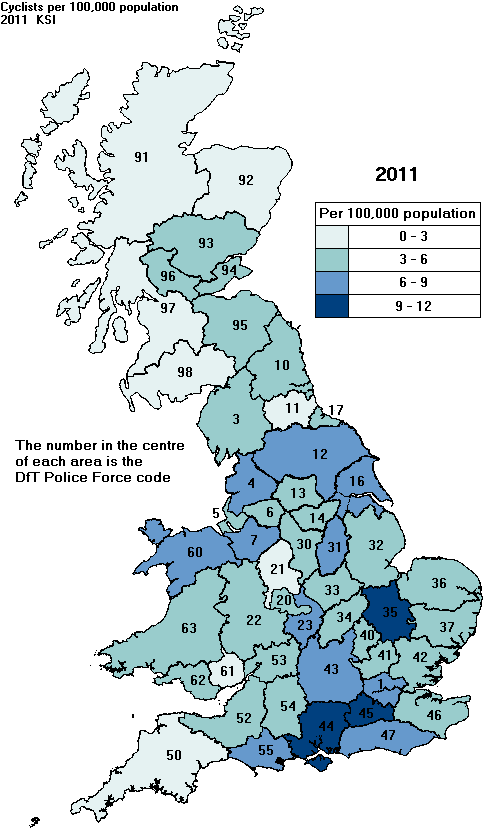 | Using DfT data, the map shows numbers of cyclists reported as killed or seriously injured in 2011 as rates per 100,000 population for the 50 police force areas of Great Britain. There have been increases in many of the areas since 2005... Read more here |
Error bars (confidence intervals) on road casualty charts:
Explanation and calculator
(March 2013)Two new sections on confidence intervals in the "Technicalities" section of the website.
|  |
|  |
Mapping of pedestrian casualty data by police area
(February 2013)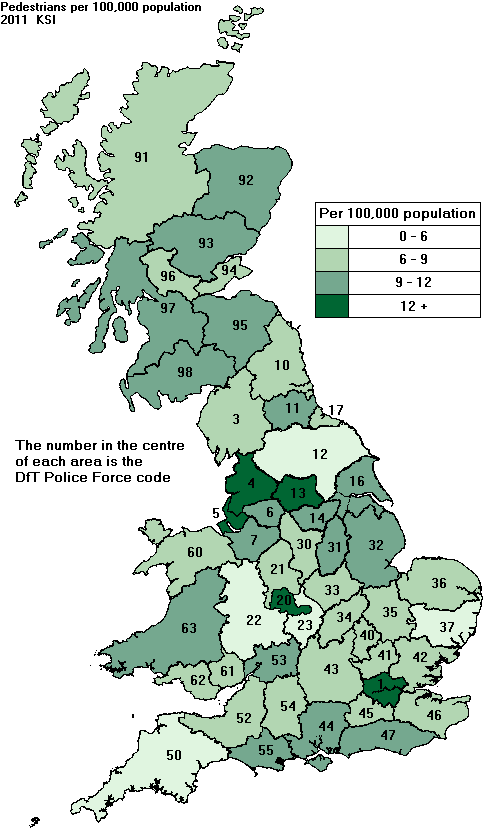 | Using DfT data, the map shows pedestrians reported as killed or seriously injured as rates per 100,000 population for the 50 police force areas in 2011. The highest rate was 2.9 times the lowest rate. Areas with the lowest rates were
Areas with the highest rates were
Read more here |
Charts and tables for each highway authority
(November 2012)Charts and tables for reported road casualties are now published here for each highway authority
These incorporate the latest DfT road casualty figures (for 2011). See here
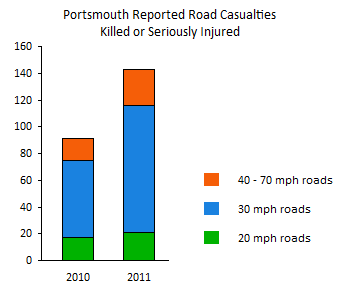
Portsmouth KSI casualties 2010 to 2011
(October 2012)A study of the rise in Portsmouth reported KSI casualties from 2010 to 2011 found the increase to be concentrated on roads with speed limits above 20 mph.
Read more here
Charts and tables for each police area
(September 2012)Charts and tables are published here for reported killed or seriously injured road casualties for each of the 50 police areas of England, Scotland and Wales.
These incorporate the latest DfT road casualty figures (for 2011). See here
2011 reported road casualties
(August 2012)The latest Department for Transport reported road casualty figures (for 2011) were released in June 2012.
See here for summary charts
This website has been set up to provide independent analysis and comment towards fair, evidence-based transport policies.
The Climate Emergency
and transport policies
and transport policies
Global warming needs to be limited to 1.5 deg.C.
The UK's CO2 budget will run out within a few years - much faster than most people realise.
Radical changes need to be made to highways so that the use of fossil fuels can drop rapidly, e.g. giving much higher priority to walking and cycling.
A useful resource is the reports from the Tyndall Climate Centre showing how quickly emissions must fall for each local authority - typically well over 10% per year.