
Pedestrian Deaths in Western European Countries
Summary
This analysis of pedestrian deaths in western European countries covers the 5-year period of 2008-12.
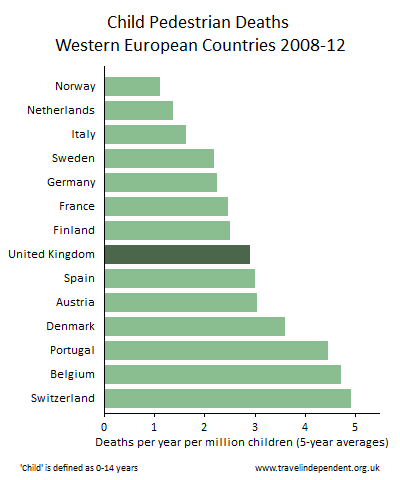
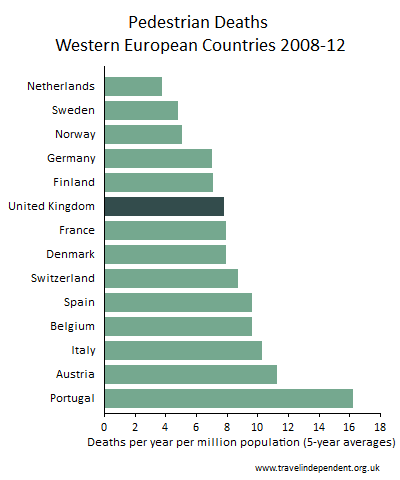
- There was a wide variation in pedestrian death rates, with the lowest being in the Netherlands, Sweden and Norway.
- The UK had a child pedestrian death rate double the rates of Norway and the Netherlands.
- In the UK, 48% of children killed on the roads were child pedestrians - this is the highest proportion in western European countries.
- Including all ages, 23% of UK road deaths were pedestrians - again the highest proportion in western European countries.
- It is not clear why UK pedestrians take such a high share of UK road casualties, but some possible factors are poor speed limit enforcement, high urban speed limits, lack of legal protection for pedestrians, and the high UK drink-driving limit.
The four charts (children 0-14 yrs on the left, total for all ages on the right) show an analysis of data published by the DfT. The raw data and the sources are given further down this page.
Rates per million population
 |  |
Pedestrian deaths as a percentage of all road deaths
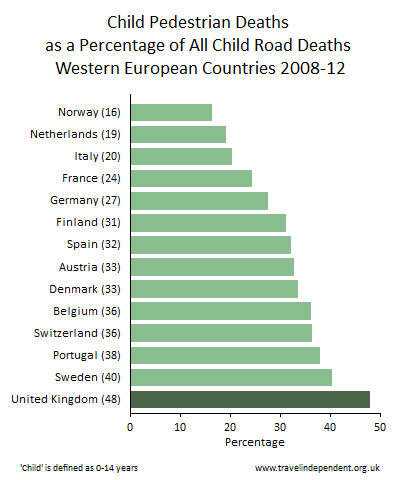 | 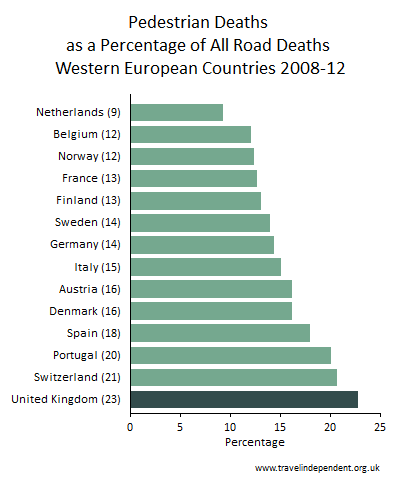 |
| For the 5-year period of 2008-12, 48% of children killed on UK roads were child pedestrians. This is the highest proportion in any western European country. Over the same period, including all ages, 23% of UK road deaths were pedestrians. This is again the highest proportion in any western European country. The UK proportion roughly equals the world average of 22% [1]. The absolute rates per million population for both child and total pedestrian deaths are also higher in the UK than in many western European countries. It is not clear why UK pedestrians take such a high share of UK road casualties, but possible contributory factors include:
|
Methods, raw data and sources
Methods
Data was taken from the five most recent DfT annual reports of reported road casualties. Five-year averages were taken in order to reduce the influence of year-to-year random variation.
Western European and Scandinavian countries were included in the comparison. The Republic of Ireland was excluded since no pedestrian data at all was available for two out of the five years. Luxembourg and smaller countries were excluded because of small population size and consequently large year-to-year random variation. This gave 14 countries for comparison.
The analysis was restricted to western European countries. Eastern European countries generally have higher road casualty rates both for pedestrians and overall.
Raw data: child pedestrians:
| Child (aged 0-14) pedestrian deaths per million population | Total child (aged 0-14) road deaths per million population | Ratio of pedestrians to total (%) | |||||||||||||
|---|---|---|---|---|---|---|---|---|---|---|---|---|---|---|---|
| 2008 | 2009 | 2010 | 2011 | 2012 | 2008-12 average | 2008 | 2009 | 2010 | 2011 | 2012 | 2008-12 average | 2008-12 averages | |||
| Norway | 2.2 | n/a | n/a | 1.1 | 0.0 | 1.1 | 9.9 | 8.8 | 3.3 | 7.6 | 4.3 | 6.8 | 16.2 | ||
| Netherlands | 1.0 | 2.4 | 1.0 | 1.0 | 1.4 | 1.4 | 7.8 | 7.9 | 5.5 | 6.2 | 8.3 | 7.1 | 19.0 | ||
| Italy | 2.3 | 1.9 | 1.3 | 1.3 | 1.3 | 1.6 | 10.3 | 8.4 | 8.1 | 7.2 | 6.0 | 8.0 | 20.3 | ||
| Sweden | 0.6 | 5.2 | 0.6 | 3.2 | 1.3 | 2.2 | 3.9 | 5.8 | 6.5 | 6.5 | 4.5 | 5.4 | 40.1 | ||
| Germany | 2.2 | 2.1 | 2.5 | 2.6 | 1.8 | 2.2 | 9.0 | 8.1 | 9.4 | 7.8 | 6.7 | 8.2 | 27.3 | ||
| France | 2.8 | 2.0 | 2.0 | 2.5 | 3.0 | 2.5 | 9.6 | 10.2 | 10.8 | 10.7 | 9.5 | 10.2 | 24.2 | ||
| Finland | 3.4 | 1.1 | 2.3 | 2.3 | 3.4 | 2.5 | 8.9 | 6.7 | 7.9 | 9.0 | 7.9 | 8.1 | 30.9 | ||
| United Kingdom | 5.0 | 3.1 | 1.7 | 2.7 | 1.9 | 2.9 | 10.2 | 6.4 | 3.9 | 4.7 | 5.0 | 6.0 | 47.7 | ||
| Spain | 3.9 | 3.3 | 3.5 | 2.6 | 1.6 | 3.0 | 12.5 | 9.0 | 11.5 | 6.1 | 7.5 | 9.3 | 32.0 | ||
| Austria | 3.1 | 3.2 | 2.4 | 4.0 | 2.4 | 3.0 | 9.4 | 11.9 | 8.0 | 10.4 | 6.5 | 9.2 | 32.7 | ||
| Denmark | 5.9 | 3.0 | 3.0 | 3.0 | 3.0 | 3.6 | 18.8 | 9.9 | 9.0 | 9.0 | 7.0 | 10.7 | 33.3 | ||
| Portugal | 4.9 | 5.5 | 2.5 | 6.8 | 2.5 | 4.4 | 14.1 | 12.9 | n/a | 11.8 | 8.2 | 11.8 | 37.8 | ||
| Belgium | 3.9 | 2.8 | 6.0 | 6.5 | 4.3 | 4.7 | 16.7 | 8.8 | 12.6 | 18.6 | 8.6 | 13.1 | 36.0 | ||
| Switzerland | 2.5 | 6.8 | 3.4 | 6.8 | 5.0 | 4.9 | 8.5 | 17.8 | 6.8 | 8.5 | 26.0 | 13.5 | 36.2 | ||
Raw data: pedestrians (all ages):
| Pedestrian deaths per million population | Total road deaths per million population | Ratio of pedestrians to total (%) | |||||||||||||
|---|---|---|---|---|---|---|---|---|---|---|---|---|---|---|---|
| 2008 | 2009 | 2010 | 2011 | 2012 | 2008-12 average | 2008 | 2009 | 2010 | 2011 | 2012 | 2008-12 average | 2008-12 averages | |||
| Netherlands | 3.4 | 3.8 | 3.8 | 3.9 | 3.8 | 3.7 | 41 | 44 | 39 | 40 | 39 | 40.6 | 9.2 | ||
| Sweden | 4.9 | 4.8 | 3.3 | 5.6 | 5.3 | 4.8 | 43 | 37 | 28 | 34 | 30 | 34.4 | 13.9 | ||
| Norway | 7.0 | 5.2 | 4.9 | 3.5 | 4.4 | 5.0 | 54 | 44 | 43 | 34 | 29 | 40.8 | 12.3 | ||
| Germany | 7.9 | 7.2 | 5.8 | 7.5 | 6.4 | 7.0 | 54 | 51 | 45 | 49 | 44 | 48.6 | 14.3 | ||
| Finland | 10.0 | 5.6 | 6.5 | 7.6 | 5.4 | 7.0 | 65 | 52 | 51 | 54 | 47 | 53.8 | 13.0 | ||
| United Kingdom | 9.6 | 8.5 | 6.7 | 7.4 | 6.7 | 7.8 | 43 | 38 | 31 | 31 | 28 | 34.2 | 22.7 | ||
| France | 8.6 | 7.7 | 7.5 | 8.0 | 7.5 | 7.9 | 67 | 66 | 62 | 61 | 56 | 62.4 | 12.6 | ||
| Denmark | 10.6 | 9.4 | 7.9 | 5.9 | 5.6 | 7.9 | 74 | 55 | 46 | 40 | 30 | 49.0 | 16.08 | ||
| Switzerland | 7.8 | 7.8 | 9.6 | 8.8 | 9.4 | 8.7 | 47 | 45 | 42 | 41 | 36 | 42.2 | 20.6 | ||
| Spain | 11.1 | 10.3 | 10.2 | 8.2 | 8.1 | 9.6 | 68 | 59 | 54 | 45 | 41 | 53.4 | 17.9 | ||
| Belgium | 9.3 | 9.4 | 9.8 | 10.1 | 9.4 | 9.6 | 88 | 88 | 77 | 78 | 69 | 80.0 | 12.0 | ||
| Italy | 10.9 | 11.1 | 10.2 | 9.7 | 9.3 | 10.2 | 79 | 71 | 68 | 64 | 60 | 68.4 | 15.0 | ||
| Austria | 12.3 | 12.1 | 11.7 | 10.4 | 9.6 | 11.2 | 82 | 76 | 66 | 62 | 63 | 69.8 | 16.07 | ||
| Portugal | 14.6 | n/a | n/a | 18.8 | 15.1 | 16.2 | 83 | 79 | 88 | 84 | 70 | 80.8 | 20.0 | ||
Sources
2008 data: DfT: Reported Road Casualties Great Britain: 2009 Annual Report (Table 51: p181)
2009 data: DfT: Reported Road Casualties Great Britain: 2010 Annual Report (Table RAS52001: p219)
2010 data: DfT: Reported Road Casualties Great Britain: 2011 Annual Report (Table RAS52001: p232)
2011 data: DfT: Reported Road Casualties Great Britain: 2012 Annual Report (Table RAS52001: p223)
2012 data: DfT: Reported Road Casualties Great Britain: 2013 Annual Report (Table RAS52001: p238)
References
| [1] | Pedestrian safety: A road safety manual for decision-makers and practitioners World Health Organisation (2013). http://www.who.int/roadsafety/en/ |
| [2] | European Transport Safety Council (2012) A challenging start towards the EU 2020 road safety target: 6th road safety PIN report http://www.pacts.org.uk/docs/pdf-bank/ETSC_PIN%20report_2012.pdf |
| [3] | "Police admit 'fobbing off' councillors over 20mph limits": http://www.oxfordtimes.co.uk/news/9933769.Police_admit__fobbing_off__councillors_over_20mph_limits/ |
| [4] | ACPO clarify their position on 20mph speed limits (2013) http://allpartycycling.org/2013/03/06/acpo-clairfy-their-position-on-20mph-speed-limits/ |
| [5] | Liability: Compensation for injured cyclists http://www.ctc.org.uk/category/tags/liability. |
| [6] | World Health Organisation (2013) Global status report on road safety http://www.who.int/entity/violence_injury_prevention/road_safety_status/2013/en/index.html |
Previous analysis
See previous analysis (of the data to 2010) here.